The Analysis of Perfusion Index and Plethysmographic Variability Index During Elective Cesarean Section
Article information
Abstract
Hypotension following spinal anesthesia of cesarean section is mainly caused by peripheral vasodilation and venous pooling due to sympathetic blockade. The degree of sympathetic blockade is known to affect the occurrence of hypotension after spinal anesthesia. The perfusion index (PI) and plethysmographic variability index (PVI) are non-invasive tools for measuring the vasomotor tone and volume status, respectively. The purpose of this study is to compare the trends of PI and PVI values between hypotension and normotension groups during cesarean section following spinal anesthesia. Fifty-one parturients were divided into two groups whether they developed hypotension or maintained normotension after spinal anesthesia. Spinal anesthesia was performed with 0.5% hyperbaric bupivacaine (10 mg) and fentanyl (15 μg) at the L3-4 intervertebral space. The data of blood pressure, heart rate, PI and PVI were recorded every minute until delivery of baby. Hypotension occurred in 61% of parturients during cesarean section. The overall PI and PVI value after spinal anesthesia have gradually increased and decreased, respectively. The degree of increase and decrease in PI (p = 0.31) and PVI value (p = 0.35) was not significant between hypotension and normotension groups. The trend of PI value has gradually increased while the PVI value has decreased, regardless of whether the parturient has experienced hypotension or not.
Introduction
Spinal anesthesia is commonly performed for cesarean section, as it has many advantages over general anesthesia. But it carries a risk of hypotension which may cause some adverse effects such as nausea, vomiting, dizziness in parturients, and umbilical arterial acidosis in the newborn [1,2].
Hypotension following spinal anesthesia is mainly caused by peripheral vasodilatation and sympathetic blockade [3,4]. Peripheral vasodilatation causes venous pooling of extremities, which results in decrease of preload [5,6]. Predicting a risk of hypotension is essential to minimize an adverse effect of the parturient and the newborn. Although management with vasoactive drugs and intravascular volume loading maintains hemodynamic stability, hypotension may not be completely avoided because of the lag in non-invasive blood pressure monitoring.
Baseline peripheral vasomotor tone, volume status, and sympathetic activity are known to affect the degree of hypotension after spinal anesthesia in parturients undergoing cesarean section [5,6]. Dynamic indices, such as stroke volume variation, pulse pressure variation, perfusion index (PI), and plethysmographic variability index (PVI) are known to be better predictors of fluid responsiveness and hypotension than static indices in mechanically ventilated patients [7,8]. Among these, PI and PVI are novel markers that can be measured non-invasively and automately from the pulse oximetry waveforms.
The PI derived from a pulse oximeter is calculated as the ratio of the pulsatile blood flow to the non-pulsatile blood in the peripheral tissue and can be used to assess peripheral perfusion differences due to changes in the peripheral vascular tone. The PI is calculated using direct current which indicates an amount of light constantly absorbed by skin, non-pulsatile blood and other tissues and alternate current which is a variable amount of light absorbed by pulsating arterial flow. The PI measured by pulse oximetry reflects patient’s vasomotor tone and a lower PI indicates greater peripheral vasomotor tone [3,4].
PVI is calculated using maximum and minimum values of PI during respiratory cycles. A higher PVI values reflect larger respiratory fluctuation of the PI values, and may indicate greater fluid responsiveness.
In previous studies, both PI and PVI had been reported as good predictors of hypotension in parturients during cesarean section under spinal anesthesia. Baseline PI over 3.5 and PVI measured after spinal anesthesia over 18% could predict the incidence of spinal anesthesia-induced hypotension during cesarean section [6,9,10].
Our hypothesis of this study was that the trends of PI and PVI values in parturients with hypotension would demonstrate different trends and patterns compared to parturients without hypotension. The primary endpoint of this study was to analyze the trends of PI and PVI values between hypotension and normotension groups during cesarean section following spinal anesthesia.
Materials and Methods
Patients
After getting approval of the study by the institutional review board (IRB No. 2020-06-040) of our institution, parturients undergoing cesarean section (June, 2020 ~ September, 2020) were enrolled. Written informed consent was obtained from each parturient in this study.
Parturients aged from twenty to forty with singleton or twin pregnancy who are scheduled for elective cesarean section were enrolled. We excluded parturients with emergency cases, cardiovascular or cerebrovascular disease, placenta previa, preeclampsia, morbid obesity with body mass index ≥ 40, gestational age 34 or 40 weeks, and contraindications to spinal anesthesia.
Spinal anesthesia
On arrival of operating room, each parturient was laid on an operating table and was given an infusion of 300 mL of Plasmalyte solution (Baxter, S.L) for prehydration. No premedication was given to the parturient and the temperature of the operating room was maintained at 22˚C. Electrocardiography, noninvasive blood pressure, pulse oximetry (Masimo Radical 7; Masimo Corp., USA) were applied. A pulse oximetry probe was placed on the left 4th finger.
Every parturient had 3 minutes of resting period in supine position to minimize the variation of baseline PI value. After 3 minutes of resting period, baseline systolic blood pressure (SBP), diastolic blood pressure (DBP), mean blood pressure (MBP), heart rate (HR), PI and PVI values were measured.
Spinal anesthesia was performed by a single anesthesiologist who had experiences in obstetric anesthesia more than 5 years. After obtaining baseline data, spinal anesthesia was performed with 0.5% hyperbaric bupivacaine (10 mg) and fentanyl (15 μg) at the L3-4 intervertebral space using 25 gauge whitacre needle. In the sitting position for spinal anesthesia, SBP, DBP, MBP, HR, PVI and PI values were also measured. After returning to supine position, a wedge pillow was placed underneath the right buttock to avoid aortocaval compression to facilitate the uterine blood supply.
The upper sensory block level was assessed 5 minutes after spinal anesthesia by loss of cold sensation using alcohol swabs. If sensory block at the T6 level was not achieved by 10 minutes after spinal anesthesia, the parturient was excluded from the study.
Plasmalyte solution was rapidly administered at a rate of 20 ml/min in both normotension and hypotension groups. The data of blood pressure, HR, PVI, and PI values were collected from the induction of spinal anesthesia until final delivery of baby every minute.
Group allocation
The parturients were divided into two groups according to whether they developed hypotension (hypotension group) or maintained normal blood pressure (normotension group) after spinal anesthesia. Hypotension was defined as a decrease of MBP < 60 mmHg or decrease more than 25% compared to baseline value for at least 5 minutes during study period. This definition was applied according to the result of a previous study [2]. When hypotension occurred, phenylephrine 100 μg and additional bolus dose were injected until hypotension was corrected. Hypotension was corrected only by phenylephrine without additional fluid administration. Every cesarean section was done by one surgeon.
Statistical analysis
Data for categorical variables are presented as the frequency, while data for continuous variables are presented as the mean (SD). The distribution of continuous variables was tested for normality using the Shapiro-Wilk test. Differences in the subject characteristics and study outcomes between the groups were evaluated using the Chi-squared test or Fisher’s exact test for categorical values and using Student’s t-test or the Mann-Whitey U-test for continuous variables, depending on their distribution. Differences in the consecutive measurements of the PI and PVI values were evaluated using repeated measures of ANOVA, followed by Bonferroni post hoc analysis for multiple comparisons.
For all analysis, statistical significance was considered as p < 0.05. The SPSS version 22.0 (IBM Corporation, USA) was used for statistical analysis.
Sample size estimation
Pilot study was performed for the estimation of sample size. Based on the result of a pilot study containing 30 parturients (15 per group), wherein PI after spinal anesthesia values (mean [SD]) were 4.0 (2.3) for hypotension group and 3.5 (1.8) for normotension group, sample size was calculated. We estimated a sample size of 20 patients per group using a two-sided t-test, a power of 80%, a significance of 5% and a dropout rate of 15%.
Results
Fifty-seven parturients were enrolled in the study. Among them, six parturients were excluded from the study because their level of sensory block was inadequate for the surgery. Therefore, this analysis was performed with fifty-one parturients (Fig. 1).

Flow chart of the study.
Hypotension occurred in 61% of parturients during the surgery. Thirty-one parturients developed hypotension during cesarean section, while the remaining twenty parturients without hypotension. Hence, those thirty-one parturients who developed hypotension were assigned to hypotension group.
Demographical characteristics of parturients were compared (Table 1). Delivery time measured after the start of anesthesia was 19.5 ± 5.2 and 21.5 ± 6.2 minutes in normotension and hypotension groups, respectively. Phenylephrine (200 ± 25 μg) was only used in hypotension group.

Demographic data
Hemodynamic values of two groups before and after spinal anesthesia were compared between two groups. Baseline hemodynamic values were not significantly different. However, minimum and mean blood pressure after spinal anesthesia demonstrated significant differences between two groups (p = 0.005, Table 2).
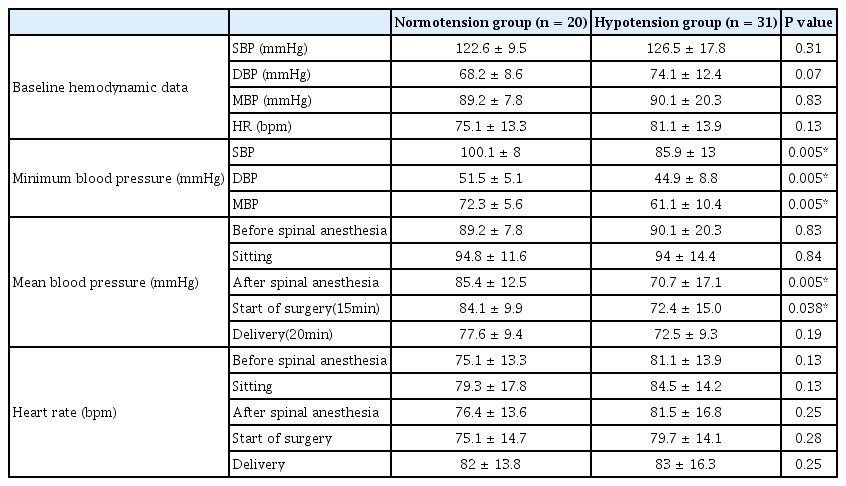
Hemodynamic data in patients before and after spinal anesthesia
The overall value of PI after spinal anesthesia has gradually increased in both groups. Although baseline PI value of normotension group was slightly higher than that of hypotension group, this difference did not show any statistical significance. PI values of both groups decreased when the position of parturient was changed from supine to sitting. From 7 minutes after induction of spinal anesthesia, PI value of hypotension group started to demonstrate higher than normotension group and such trend of increase was maintained until final delivery of the baby. However, the difference of PI values between two groups was not significant during whole period of PI measurement (p = 0.31, Fig. 2).
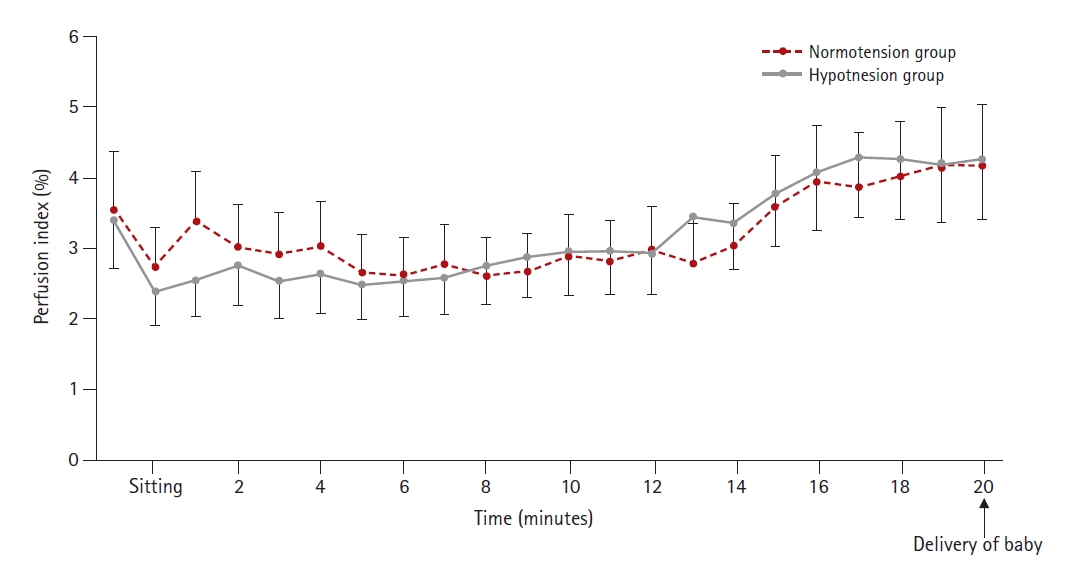
Changes of perfusion index (%) in normotension and hypotension group.
Immediately after spinal anesthesia, the PVI value increased in both groups and then it gradually decreased until delivery of the baby. The PVI values of hypotension group were greater than that of normotension group, except for a few minutes after the induction of anesthesia (p = 0.35, Fig. 3).

Changes of plethysmographic variability index (%) in normotension and hypotension group.
Discussion
In this prospective study, the results showed that the overall trends of PI and PVI in both groups were gradually increased and decreased, respectively. However, there was no significant differences in PI and PVI values between two groups after spinal anesthesia.
Spinal anesthesia causes sympathetic blockade in the affected lower extremities [3]. It causes the decreased systemic vascular resistance, blood pooling in the blocked area, leading to reductions of cardiac output and mean blood pressure.
Normal physiologic changes of third trimester of pregnancy include decrease in systemic vascular resistance, increase of blood volume, stroke volume, heart rate, and cardiac output. Because of pregnancy-induced decrease in vascular tone, parturients have more blood volume trapped in extremities, and have higher PI and PVI values than non-parturients [1].
Previous studies showed that higher baseline PI and PVI values have an ability to predict the hypotension after the spinal anesthesia for cesarean section [6,9]. Greater PVI value after spinal anesthesia is also associated with incidence of hypotension [10]. According to the previous studies, the baseline PI and PVI values of hypotension group were expected to be higher than that of normotension group. Our study showed a higher baseline PVI values in hypotension group, whereas higher baseline PI values in normotension group.
The increased PVI value immediately after spinal anesthesia was an independent risk factor of spinal anesthesia-induced hypotension [10]. This study also showed increased PVI value immediately after spinal anesthesia. However, the degree of increase was higher in normotension group than hypotension group. Kuwata et al. [10] suggested optimal PVI threshold of 18% to predict hypotension after spinal anesthesia. However, in this study, the PVI value of hypotension group was maintained less than 18% until delivery of baby except for 3 minutes immediately after induction of spinal anesthesia.
Contrary to the study by Toyama et al. [6] which demonstrated higher PI value at baseline to predict hypotension, our study showed lower PI value in hypotension group from baseline to 7 minutes than normotension group and then it was reversed. In this study, the pulse oximetry probe was placed on left 4th finger of the parturients. Therefore, PI values can represent the vasomotor changes of upper extremities. We suppose that lower PI value of hypotension group from baseline to 7 minutes after spinal anesthesia is due to the difference of uppermost level of sensory block between two groups. In former studies, high thoracic sensory block (C7-T3) induced thoracic sympathetic block that proceeds and exceeds sensory block [11,12]. Ginosar et al. [5] have demonstrated that an increase in PI value was an earlier and more sensitive indicator of the development of epidural induced sympathectomy compared with an increase in skin temperature. We suppose that uppermost level of sensory block from spinal anesthesia was lower in hypotension group than normotension group immediately after spinal anesthesia. Such lower level of sensory block in hypotension group resulted in an increased vasomotor tone of upper extremity compared to normotension group, leading to lower PI value. However, after 7 minutes, hypotension group might become similar or even higher sensory level compared to normotension group since PI started to show higher than normotension group.
According to the conflicting result of our study compared to previous studies [6,9,10], overall application of PI and PVI value to predict hypotension has some limitations and it requires further study.
In our study, 61% of parturients developed hypotension after spinal anesthesia. This is in consistency with former studies under the same definition of hypotension (59.3%) [2]. The incidence of hypotension during spinal anesthesia for cesarean section varies, ranging from 7.4% to 74.1% [2]. We think that this variation results from the definition of hypotension which was used during their study.
This study did not show any significant differences in PI and PVI values between two groups after spinal anesthesia. One reason is that spinal anesthesia was performed under sitting position not in the decubitus position by previous studies [6,10]. Different position during spinal anesthesia can potentially affect the values of PI and PVI. In addition, small sample size of this study might have resulted in different values compared to previous studies [6,10].
Our study has several limitations. First, photoplethysmographic analysis is sensitive to emotional stress, anxiety, and movement of the patient. Although all parturients in this study had 3 minutes of resting period to minimize such emotional factor, the resting period of 3 minutes might be too short to remove emotional factor entirely. Second, PVI may be less accurate in evaluation of intravascular volume and prediction of fluid responsiveness in spontaneously breathing patients, which may be related to the greater changes in respiratory rate and tidal volume. Third, physiologic conditions vary between patients, therefore, PI may be considered as a relative number which reflects the change of trends rather than an absolute number. Fourth, we did not check the uppermost level of sensory block, but we only checked whether the sensory loss reached to T6 dermatome or not.
In conclusion, we demonstrated that the trend of PI value has gradually increased while the PVI value has decreased, regardless of whether the parturient has experienced hypotension or not. Further studies using PI and PVI values should be conducted to assess the effect of hemodynamic variations in spinal anesthesia for cesarean section.
Notes
Conflict of interest
All authors declare no conflicts-of-interest related to this article.