


Introduction
According to a survey conducted by the Korea Creative Content Agency in 2018, the gaming usage rate of Korean youth was 91.9%, and video games have become the number one leisure activity [1]. Although video games have become widespread and famous, the potential negative impact of video games as a leisure activity on the player base has been a concern for the general public. Numerous studies have pointed to an inverse association between video games and adolescent mental health [2]. The most direct effect of the time adolescents spend on video games is away from real-life interpersonal interactions, which can exacerbate social relationships and lead to feelings of isolation [3]. Therefore, the development of loneliness is expected in adolescents who enjoy playing games.
Loneliness in adolescence can be defined as distress brought about by one's own frustrated need for social and emotional interaction with others and negative evaluations of social relationships [4]. Some studies have shown that loneliness is high among Korean adolescents [5]. Moreover, adolescents with high levels of loneliness are likely to experience various maladaptive problems such as depression, anxiety, suicide, smoking, drinking, and failure in school due to feelings of despair, misanthropy, and powerlessness [6].
While most previous research has focused on the causes and mechanisms that may underlie the development of loneliness, the trajectory of change in loneliness has been less studied within Korea, especially among high-risk groups such as game players. Adolescence is a time of dramatic physical and psychological change, and loneliness may exhibit a high degree of instability [7]. Therefore, there is a need to explore the trajectory of adolescent game players' loneliness over time to understand the mental health of adolescents. The research question in this study is, how does loneliness among adolescent game players change over time?ŌĆā
Materials and methods
Data
This study used Game Players Panel data from Korea Creative Content Agency to explore loneliness changing trajectory in adolescent game players. The survey included adolescents in the fourth grade of primary school, first grade of middle school and first grade of high school in Seoul and the metropolitan area. This study analyzed the response data of adolescents who participated in the first half of the study's third/fifth/seventh/ninth responses. The total number of participants was 778, of which 381 (49%) were male and 397 (51%) were female.
Measurement
The Korean Creative Content Agency's Game Players Panel Data measured loneliness using ten items from the UCLA Loneliness Scale. Of these, eight were negative questions, and two were positive questions. We reverse-scored the two positive questions to create a total score for loneliness. The CronbachŌĆÖs alpha for loneliness is 0.912, 0.912, 0.909, and 0.916.
Analysis strategy
All research questions in this study were analyzed using a latent growth model based on structural equation modelling. Specifically, this study conducted a longitudinal data analysis in two steps. First, descriptive statistics and correlation analyses were performed on the main variables. Second’╝īno-change, linear growth and quadratic growth models were developed to fit the change in the data, and the model with the best fit index was selected. Model fit was tested using chi-square (Žć2), Comparative Fit Index (CFI), Tucker-Lewis Index (TLI), and Root Mean Square Error of Approximation (RMSEA).
Descriptive statistics and correlation analyses between the main variables in this study were performed using SPSS 26.0, and latent growth models were analyzed using Amos 24.
Result
Correlation analysis and descriptive statistics among the main variables
The results of the descriptive statistics and correlation analyses of the variables are shown in Table 1. The analysis results show that the mean values of loneliness among adolescent game players show a trend of increasing and then decreasing. The results of the correlation analysis showed that the values of loneliness at each time point were positively correlated.
Changes of loneliness
In order to analyze changes in loneliness among adolescent game players, no change models, linear growth models and quadratic growth models were developed. The fit of each model for unconditional potential growth is shown in Table 2. According to the the model fit, RMSEA less than 0.05 is a perfect fit, between 0.05 and 0.08 is a good fit, and bigger than 0.08 is a bad fit [8]. In contrast, the no-change model, RMSEA was 0.9, and the fit performed poorly. However, both the linear and quadratic growth models met the requirements.
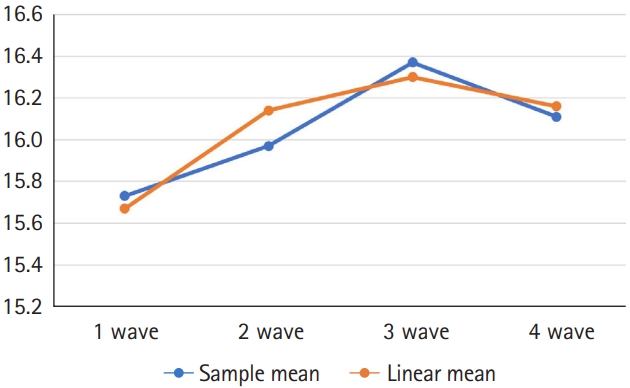
A chi-square test (╬ö Žć2 = 19.36, ╬ö df = 2) showed p-value significant, indicating a significant difference between the two models. The quadratic growth model had a smaller chi-square value, so the quadratic growth model was chosen as the final model better to describe the change in loneliness among adolescent game players. In addition, the estimated means of the linear growth model were 15.82, 15.98, 16.15, and 16.31, while the estimated means of the quadratic growth model were 15.67, 16.14, 16.30, and 16.16. Combined with the sample means in Table 1, the difference between the estimates of the quadratic growth model is smaller than the difference between the sample means and the estimates of the linear growth model. It is shown in fig. 1 and fig. 2 Therefore, the quadratic growth model can better fit the trajectory of the data.
As shown in Table 3, the initial value of loneliness for adolescent game players was 15.67, with a variance of 19.954 (p < 0.001), which implies that there is individual difference in the change of loneliness over time. The slope of linear growth was 0.62 (p < 0.01), which suggests that loneliness increased 0.62 per year over time. The slope of the quadratic was -0.152, which suggests that loneliness decreased by 0.152 per year in later years. In addition, there was a significant correlation between the linear and quadratic slope of change in loneliness. However, between the initial value of loneliness and the linear sloe and between the initial value of loneliness and the quadratic slope, the correlation was not significant. In other words, the initial value of loneliness of adolescent game players did not affect the linear and quadratic slope of loneliness. This suggests that there may be other factors that influence the slope of adolescent game players.
Discussion
This study aims to analyze how loneliness among adolescent game players changes over time. The loneliness of adolescent game players shows a quadratic growth trajectory of change over time that increases and then decreases. There are significant individual differences in the initial values and rates of loneliness change. There are significant correlations between linear and non-linear rates but no statistically significant relationship between initial value and rate of change. This is not the same as most current researches showing that loneliness increases linearly through adolescence. The trajectory of change in loneliness of the participants in this study took the trend of increasing and then decreasing, possibly because the positive attitude towards being alone during adolescence increased with age [9]. Specifically, adolescent game players may be more affected by being alone in the early years, so loneliness is always on the rise. However, by late adolescence, when adolescence is no longer afraid of being alone and has learned to appreciate the positive aspects of being alone, playing alone does not feel as lonely as it used to. Thus, feelings of loneliness slowly begin to diminish. This is similar to the findings of van Dulmen and Goossens [10]. Adolescent game players are a high-risk group for loneliness, and social workers should develop intervention services based on the timing and characteristics of changes in their loneliness to improve their effectiveness.